RSS

Strata Tip of the Week - What is the Strata Corporation Required to Insure?

All strata corporations in BC, regardless of size, must obtain property and liability insurance, including bare land strata corporations and strata-titled duplexes.

1. Property Insurance

A. The strata corporation’s property insurance must be for:

  • Common property

  • Common assets

  • Buildings shown on the strata plan, and

  • Fixtures built or installed on a strata lot if built or installed by the owner developer as part of the original construction of the strata lot (e.g., the original flooring, cabinets, etc.)

B. Property insurance must be for the full replacement value (which requires a current appraisal) and insure against all major perils, which include:

  • fire, lightning, smoke, windstorm, hail

  • explosions

  • water escapes

  • strikes, riots or civil commotion

  • impact by aircraft and vehicles

  • vandalism and malicious acts

One surprising fact is that, under the Strata Property Regulationearthquake insurance is not considered a major peril. However, purchasing a unit in a strata corporation that does not have earthquake insurance can pose significant risks. If that is the case, it is important that you make your clients aware, and advise them to seek professional insurance advice.

 2. Liability Insurance

The strata corporation must also obtain and maintain liability insurance to insure the strata corporation against liability for property damage and bodily injury, for a minimum amount of $2,000,000.

3. Strata Homeowner Insurance

It’s important to realize that strata corporation insurance is not the same as strata homeowner insurance. In order to mitigate their risks, many strata owners in BC obtain additional homeowner insurance, which often insures them for:

  • Their household contents

  • Upgrades made to the unit

  • Strata deductible coverage (which protects them in case they are found responsible for paying the strata’s deductible(s).

It is always a good idea to recommend to your clients that they take a copy of the strata’s insurance policy to their insurance broker, to have a discussion about their ability to get additional homeowner insurance, as well as the costs associated with this. That way they’ll have a good understanding of their ability and the costs of mitigating certain risks.


That’s it for this week. If you have any suggestions for other topics you’d like us to cover, please let us know at info@condoclear.ca.


Disclaimer: The information provided is for general purposes only. It is not intended to provide legal advice or opinions of any kind. No one should act, or refrain from acting, based solely upon the materials provided, any hypertext links or other general information without first seeking appropriate legal or other professional advice.

Read

The Risks Associated with Low Strata Fees

There is no doubt that it’s important for strata corporations to be fiscally responsible. That being said, strata corporations whose main focus is keeping strata fees as low as possible can, at times, make decisions that lead to low strata fees in the short term, but significantly higher costs to owners in the long term.

Some risks associated with very low strata fees include:

  • Deferred repair and maintenance, which can result in premature failure of building components.

  • Significant increases in strata fees every few years, rather than gradual yearly increases.

  • An underfunded contingency reserve fund, resulting in significant special levies to owners.

  • Owner frustration as a result of under maintained and under serviced grounds and amenities.

  • Additional emergency expenses as a result of unexpected building component failures.

  • Negative effects on real estate values as a result of negative perceptions of the strata corporation

Because there are so many variables influencing expenses within a strata corporation (such as building sizelocationamenitieslong term planning strategies, etc.), caution should be taken when comparing one strata’s fees with another.

The best way to determine whether a strata corporation’s fees are enough to effectively repair and maintain all the corporation’s assets is through:

  • a detailed review of the strata documents, as well as

  • a thorough inspection of the property

Working together with various industry experts, including Realtorshome inspectors and strata document review providers (such as Condo Clear), will enable consumers to make more informed decisions on whether the stratas they are looking to purchase into are maintaining the property well and doing a good job budgeting for short and long term expenses.
Read


  • Bank of Canada holds prime rate at 5% but keeps door open to further hikes

  • Median price of a West Side detached house up $1 million in past year

  • Total new listings have been falling, month-over-month, since May

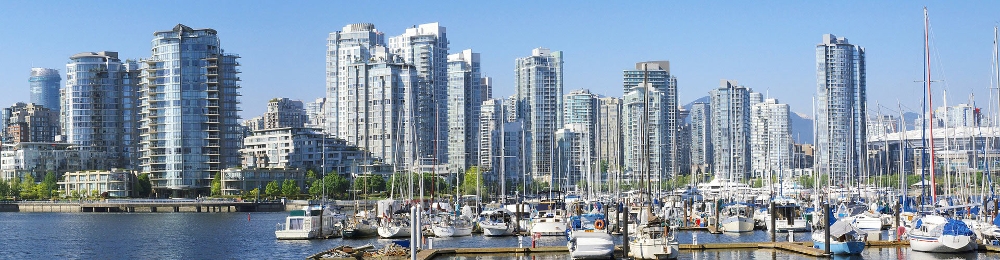
  • East Vancouver is leading all markets in detached house sales 

  • South Delta detached houses are moving to a buyer’s market 

It is a sad commentary on the Greater Vancouver housing market when buy and sell decisions hinge more on minuscule interest rate moves than on the pragmatic needs of consumers.  But that is what is happening. Two more consecutive Bank of Canada rate hikes in June and July – at 0.25% each – were enough to drive August housing sales down to the lowest level in six months and stall a rally in new listings, which fell 16% from a month earlier.

The Bank of Canada held the prime rate at 5% at its September 6 setting, but any confidence was dashed as the Bank warned that it would not hesitate to jack rates higher if the economy – and the housing market – began to heat up again.

The best advice for buyers is simply to take today’s higher lending rates into the equation and do the best to negate them. It is clear the Bank of Canada is failing, failing to admit it overshot on rate increases over the past year and trying to maintain the illusion it knows what it is doing.

Those considering purchasing a home between now and the next Bank of Canada scheduled rate hike announcement on October 25th should secure a pre-approved 120-day mortgage and talk to a mortgage professional about the best rate and term. 

However, buyers and sellers should not be blinded by interest rate fluctuations. It is likely, considering the economic damage already done, and political pressure, that Bank of Canada rates will not increase again this year. Instead, buyers should concentrate on property values and sellers on matching their price to the market.

Buyers cannot ignore the investment dynamics this year. In the past six months, as both sales and listings fell, prices have continued to increase. The August 2023 benchmark price, at $1,208,400, is $65,000 higher than in March of this year. The benchmark detached house price was up $156,000 to $2,018,500 in the same period and the typical condo apartment price increased by nearly $40,000 while townhouse benchmark prices have risen 5% since March to $1,103,900. But August benchmark prices across Greater Vancouver were down 0.2% from July 2023 and strata prices have barely budged in three months. 

A key reason for a lack of new listings is universally higher prices that have frozen sellers in place and lower rates they currently have on mortgages. A look at the 20 Greater Vancouver markets shows that the August benchmark price varies very little from Bowen Island ($1.41 million) to the Westside of Vancouver ($1.34 million) or from East Burnaby ($1.19 million) to Ladner ($1.17 million). The potential of pocketing a healthy dividend when moving within the region is diminished, persuading many potential sellers to stay put. 

It currently feels like a market waiting for an excuse to buy mixed with a reluctance to sell.

Growing pent up buyer demand may be the best way to explain the status of the market. But without any increase in listings, it makes it difficult for that pent up demand to release. And there’s little to suggest we’ll see any increase in supply. 

Banks are working with homeowners to keep mortgages funded – one option is allowing 30-year amortizations - and many with lower rate mortgages are unwilling to dive into the high interest rate pool and make a move. Expect that when the mortgage climate changes to more favourable buyer conditions, sales levels will increase in a significant way. The number of new listings in August was 6% below the 10-year average and has been falling, month-over-month, since May. This has kept it a seller’s market with only a 4-month supply of listings available – even with the low sales levels. This is going to keep the overall inventory of listings at two thirds the level they should be to get to balance or to favour buyers.

The bottom line is that September, often a bellwether month for sales, could ring in a traditional market rally, especially with no further increase in lending rates. This is the time for buyers and sellers to take advantage of the upturn.

If you are considering a sale, it is better to list now before fall competition increases. For those looking to buy, the current price stability offers a short-time opportunity.

Regional market data for August 2023

Greater Vancouver: There were a total of 2,296 sales in August, down 6% from July and 23% fewer than in June 2023, but up 21% from August of 2022. Active listings were 10,082 at the end of August, compared to 10,099 at that time last year and 10,301 at the end of July. New listings in August were down 16% compared to July 2023, but up 19% compared to August 2022. Despite a rally over the past six months, overall prices have stabilized. The composite home price in August, at $1,208,400, was up just 2.5% from August 2022, though 27.6% higher than in August of 2020. With a tight supply and a sales-to-listing ratio of 57% in August, Greater Vancouver remains in a seller’s market. 

Fraser Valley: The Fraser Valley Real Estate Board recorded 1,273 sales in August 2023, a decrease of 6.9% compared to July. Sales were up 25.2% compared to August 2022. New listings dropped to 2,622 in August, down 8.2% from July, but 28.2% above August 2022. Active listings have been rising since last December and grew again in August by 1.5%, from July, to 6,291, just 7% off the 10-year average. The overall benchmark home price in August was $978,066 and all sector prices were nearly unchanged (down 0.6%) from July 2023 but up slightly from August 2022. The biggest year-over-year price move was condo apartments, up 2.5% from August 2022, to $553,500.

Vancouver Westside: There was a price shocker in this trendsetting market in August. Only 141 detached houses were listed for sale and 69 of them sold for a median price of $4,070,000, almost exactly $1 million more when compared to August 2022. We believe this is an unprecedented one-year median price increase anywhere at any time in Canada. To say detached demand is high is an understatement. Strata action was more muted, with townhouse and condo apartment sales and median prices nearly level with July 2023. Condo medians, at $820,875, were nearly the same as in August 2022.

Total August sales were 433, down 1% from July 2023, and up 18% from August 2022. New listings in August were down 20% compared to July 2023, but up 13% compared to August 2022. The inventory of total residential listings is steady at 5-month supply, creating a balanced market with an August sales-to-listings ratio of 53%. 

Vancouver East Side: More detached houses sold on the East Side in August than in any other market in Greater Vancouver. The 80 detached transactions were also much higher than in August 22, when 57 houses sold. Prices are the key. At a benchmark of $1,913,500, East Vancouver detached prices are $1.6 million less than on the neighbouring Westside and about $100,000 below the Greater Vancouver benchmark. Some of the sales impetus could be from investors trying to assemble East Vancouver detached lots in anticipation of the higher-density zoning expected this fall, which would allow up to six housing units on detached lots. Total August sales reached 250, down from 286 (13%) in July 2023, but up from 196 in August 2022. Active listings were at 1,013 at month end, though new listings in August were down 25% compared to July 2023. This is a seller’s market with a tight supply and a sales-to-listing ratio at 66%, the highest since August 2021.

North Vancouver: The strata market is strong in North Vancouver, with a sales-to-new listing ratio of 74% and sales up sharply from both a month and a year earlier, even as sales of detached houses fell. There were 85 condo apartment sales in August, at a benchmark price of $817,400, up 0.4% from July 2023. There were 38 townhouse sales, at a benchmark of $1,312,100, but this price was down nearly 3% from a month earlier. Detached house prices, benchmarked at $2,268,000, have not budged in three months, but remain 2.4% higher than a year ago. The supply of total residential listings is steady at a tight 3-month supply, confirming this as a seller’s market. 

West Vancouver: August sales were up month-over-month driven by the detached segment – not hearing that very often these days, especially in West Vancouver. It was the highest detached absorption rate since April for the community. Total sales were 57 in August and detached transactions accounted for 34 sales, at a benchmark price of $3,273,900, a price up 10% from six months ago, but still 2.4% below August 2022.

New listings in August were down 20% compared to July 2023 and down 3% compared to August 2022. This is a buyer’s market, with a 10-month supply of listings and a 39% sales-to-listing ratio. 

Richmond: Richmond prices have flatlined over the past three months, though they remain about 4% higher than a year ago, with the benchmark price at $1,187,900.

Listings are down, as are new home starts. As of August 1, only 273 new condos had started, for example, down from 378 at the same time last year, and total listings were down to 1,162 at month’s end, about 200 units lower than a month earlier. We estimate there is only a 4-month supply in this seller’s market, with a sales-to-listing ratio at 64%, up from 54% a month earlier.

Burnaby East: This is a seller’s market but with few sellers and even fewer buyers, with just 31 sales in August from a total inventory of 83 homes for sale. There is only a 3-month supply on the market and the sales ratio is running at 82%, the highest in at least two years. The benchmark home price in August was $1,195,100, down 0.7% from a month earlier, but up nearly 7% from August 2022.

Burnaby North: Total sales in August reached 139, down 13% from July 2023 but up 16% from August of last year. We may see an increase in sales of detached houses right across Burnaby this year as the City prepares to allow laneway homes on detached lots. The laneway houses can be up to 1,500 square feet but they are also restricted to long-term rentals. The benchmark price of a Burnaby North detached house is $2,047,100, up 10% from six months ago but unchanged from July 2023. New listings in August were down 11% compared to July 2023, but up 36% compared to August 2022. Total residential listings reflect a 4-month supply, and the sales-to-listings ratio is 54% in this seller’s market,

Burnaby South: While total sales are up from last year, they have been tracking down for three months, with the 133 transactions in August down 24% since June and 4% below July 2023. Prices dipped 0.3% from July to a composite benchmark of $1,138,100. New listings in August were down 10% compared to July 2023, but up 26% compared to August 2022. Residential listings are steady at 3 month’s supply, but the detached market is flirting with a buyer’s market. The overall sales-to-listings ratio is 62% compared to 59% in July 2023, and 73% in August 2022.   

New Westminster: The Royal City was recently named the most livable city in the Lower Mainland and Number 3 in B.C., but after a surge in July sales, it posted one of the biggest declines in month-over-month sales in August. Total August sales, at 87, were down 27% from July 2023 but up from 77 transactions a year earlier. New listings dropped 16% from July, but total active listings are steady at 299 units. This includes a welcome increase in townhouse listings, which are now at a 5-month supply. Prices are holding firm, with townhomes benchmarked at $959,600, up 3% from a year ago; condo apartments also up 3% at $659,200; and detached houses at $1,587,300, unchanged from July 2023 but 9% higher than a year earlier. New West remains a seller’s market with a sales-to-listing ratio of 56%.

Coquitlam: With the imminent start of the massive Fraser Mills development and other condo projects, Coquitlam will be seeing higher starts by next year, but new supply so far in 2023 has plunged. Only 795 new homes have started, compared to 1,923 in the first seven months of 2022. Meanwhile, new listings in August were down 28% compared to a month earlier and total active listings, at 599, are down from 636 in July 2023. All sector prices are unchanged from July 2023, with the benchmark price up a mere 1.2% from a year earlier. With just a 3-month supply of listings and a sales ratio of 69%, this is a seller’s market despite the flatline prices. 

Port Moody: Another strata/rental project in Port Moody has stalled at the design approval stage in a city that has had challenges getting new projects to market. The latest is a proposed six-storey, 60-unit project on St. John’s with 30 strata condos. New listings in August were down 31% from both July 2023 and August 2022 and there are only 167 active listings, lowest in a year. Still, with recent approvals, 306 new apartments have started so far in 2023, compared to just 5 a year ago, so there is progress on supply. Total sales in August were down 31% from July with 58 transactions. Condo benchmark prices are steady at $729,600 and detached houses at $2,076,500, are down 2.8% from August 2022, one of the few year-over-year declines in detached values. This is a balanced market with a total sales-to-listing ratio at 75%, compared to 43% a year ago and a healthy 6-month supply of detached listings. 

Port Coquitlam: A total of 60 properties sold in August, down 5% from July and off 11% from August 2002. New listings are tracking down and total active listings at the end of August were 169, compared to 172 a month earlier. With a sales-to-listing ratio of 60%, this is a healthy seller’s market and worth a look at by buyers. The benchmark home price was unchanged from July at $971,400, the lowest price in the Tri-Cities.

Pitt Meadows: Aside from Squamish and the Sunshine Coast, Pitt Meadows posted the biggest month-over-month detached house price drop in August, with the benchmark price down 2.8% from July 2023, to $1,317,800. Total units sold in August were 23, down 4% from July 2023 but up 35% from August 2022 so the detached price slide is a bit of a puzzle. The supply of total residential listings is steady at 3 month’s supply, while the sales-to-listings ratio of 60% confirms this as a seller’s market. 

Maple Ridge: Total sales in August were 119, down 17% from July 2023, but up from 113 transactions in August 2022, New listings in August were down 4% compared to July 2023 and up 17% compared to August 2022. The total supply of residential listings is up to 5-month supply (balanced market conditions), with a sales-to-listings ratio of 43% compared to 50% in July 2023. The benchmark price, at $1,005,700 has held steady (up 1.5%) since August of last year.

Ladner: While detached house listings are now at 6-month supply and in a balanced market condition, the strata sector is a different story with a shortage of both townhouses and condo apartments. Total new listings August were down 43% compared to July 2023. Despite the shortfall, prices are stable: the townhouse benchmark in August was $988,000, unchanged from July, while the condo benchmark was up 2%, month-over-month, to $731,900. Detached prices were unchanged from July, at $1,446,000, up 2% from a year ago. This is a seller’s market with a sales-to-listing ratio of 73% and a tight inventory. 

Tsawwassen: Detached houses are now in a buyer’s market with a 9-month supply and August benchmark prices are down 3% from a year ago to $1,547,800. Opportunity awaits detached buyers here. Townhomes are maintaining sales levels while there were more condo sales than new listings in August. There were just 28 sales in all during August, down 15% from July 2023. Active Listings were at 162 at month end compared to 179 at that time last year and 161 at the end of July. With a 6 month supply of total residential listings and sales success ratio of 52%, this is a balanced market.

Surrey: B.C.’s second-biggest city posted mixed results in August, with detached sales and prices flatlining from a month earlier and sales of strata units falling from July 2023. Detached sales reached 175, unchanged from a month earlier, while the benchmark price was down 0.5% month-over-month to $1,675,900. Townhouse sales fell 13%, month-to-month, to 189 transactions and the benchmark price was down 1.3% to $881,600. Condo apartment sales were down 7.6% from July at 207 units and the benchmark price was off 1% to $548,200. 


Read

Think you don’t need a home inspection when purchasing a new build? Think again! Here are four reasons you need a home inspection—even if it’s a new build. 

 Tips for new home inspections

1. A home inspection is different from the final walk-through with the builder

During the final walk-through with the buyers, their REALTOR® and the builder, any last-minute details—like paint touch-ups—can be fixed before you get the keys. According to the Canadian Home Builders’ Association (CHBA), many new homes and condos built by licensed builders carry a third-party home warranty—they’re mandatory in Quebec, Ontario, Alberta, and British Columbia, but in other provinces, individual builders can decide whether to offer one or not. CHBA members are required to offer a warranty.

Generally, this warranty protects the buyer against any material or workmanship defects, but only if they’re found before the coverage expires—usually between one and five years. Often, making a warranty claim after you’ve moved in and having crews coming to your property to deal with problems can be time-consuming, inconvenient, and stressful.

Unlike during a walk-through, a professional home inspector goes through your new property from top to bottom before the final walk-through and provides a written report detailing any problems that may have been overlooked by tradespeople. 

Home Inspection Report

2. A home inspector provides an impartial, expert report

Just because a house is new doesn’t mean it’s perfect, says Pascal Cabana, a building expert and technical supervisor at Legault-Dubois in La Prairie, Quebec. The company offers home inspections and other services including air quality testing and lab analysis.

“There can be a mouldy attic, an improperly installed window, or a creaking floor,” explains Cabana. “It’s much easier to have these problems rectified by your contractor before taking possession of the building than having to resort to the warranty.”

Having a home inspection report in hand during the pre-delivery walkthrough also helps ensure all issues are dealt with, says Cabana. 

“The client and the contractor write down the elements to be corrected or completed and enter due dates for the work, which shouldn’t exceed six months. Only once everything is in line with the client’s expectations do they agree to take possession of the house, and here’s where the services of a home inspector are very valuable,” he explains. That’s because when the buyer already has a list of things that need attention, the information can be clearly related to the contractor during the final walkthrough.

“The inspector’s expertise allows buyers of new homes who do not know the building to benefit from an impartial, professional opinion on the state of the work,” adds Cabana.

Here are some things home buyers need to inspect

3. Mistakes can happen, and inspectors often find them

While most builders deliver high-quality work, mistakes can happen.  

“During our inspections of new homes, the most frequent problem encountered is everything related to flashings: balconies, doors, and windows junctions. These are points prone to water infiltration,” Cabana explains. 

Cabana has also seen issues with landfilling that doesn’t leave adequate clearance between the ground and the bottom of the exterior wall, indoor garages that leak, and new condos that are not airtight, which can lead to humidity and condensation problems. Provinces have different established inspection checklists for new condos or homes, notes Cabana.

“Through this list, the building inspector will inspect the foundation, the exterior cladding, the roof, the doors, and the windows to verify the quality of the installation,” he explains. “They’ll inspect the stairs, terraces and balconies, the chimney, and the exhaust ducts. Inside, they’ll focus on interior finishes, lighting, ventilation and heating systems, plumbing, and so on.”

House Inspection

4. A home inspection can save you headaches

Buyers may assume if their property is covered under a residential construction warranty, they don’t have to worry if something goes wrong once they move in. However, it’s always easier for the buyer and the contractor to carry out corrective work while the workers are still on site, advises Cabana. 

“Otherwise, the contractor must withdraw part of their team from another site to return and rectify the situation, which leads to additional expenses and delays on the contractor’s other sites,” he says. “This can cause resentment and insecurity for the owners plus friction and inconvenience for everyone.”

Expect to pay $550 or more for a condo unit inspection, and more than $800 for a new home. A home inspection can give buyers something priceless: peace of mind. Your REALTOR® can help guide you through the entire new construction process and be a valuable resource.

 Buyers Home Inspection Checklist

Read

When putting in an offer on a home, one condition that’s almost always included is a home inspection. Although not mandatory, it’s always recommended because it can save you headaches down the road. As a potential buyer, you want to make sure there aren’t any red flags with a home’s electrical, plumbing, foundation, and structure.

InterNACHI® is the world’s leading association for home inspectors. Similar to a REALTOR®, InterNACHI® licensed professionals stay-up-to-date with industry trends and adhere to a comprehensive standard of practice. Canada’s arm of this organization is CanNACHI®. Whether you’re a buyer or seller, if you’re looking for a professional to perform a home inspection, if possible, be sure to reach out to one who has this licence.

Home inspectors look at many different elements within a home, and there are some areas they pay more attention to than others. Below are some top issues they can spot, sometimes even before walking through the door.

Cracks in the drywall and foundation

1. Cracks in the drywall and foundation

Old or new, most homes will have minor cracks. Although the thought of seeing cracks in a wall or floor might put you off, Shawn Anderson, CanNACHI®-certified owner of The Inspector in Vancouver, British Columbia, says “most drywall cracks are due to settlement or poor installation and are not often a cause for concern.” The location, shape, size and direction of a crack is also important. 

“Horizontal, uneven, and/or diagonal cracks could be an indication of movement,” says Anderson, “as well as cracks in the foundation which could be a possible sign of a major problem.” 

Common electrical problems

2. Electrical work 

The most common electrical issue Anderson sees during an inspection is unsafe electrical installations. 

He says, “often the wrong size breaker is installed or multiple circuits on one breaker (also known as double tapping).” Flickering lights can also be an indication of poor electrical work. 

Both of these issues are a safety concern because they can cause damage to electrical infrastructure. Although it’s harder for an untrained eye to spot electrical issues, some easy ones to look for during a walkthrough include flickering lights, loud buzzing sounds, and crowded or tangled wiring. 

Plumbing inspection

3. Plumbing

When it comes to plumbing, inspectors will take a look at the hot water tank, drainage system, fixtures, metres, and valves. Hot water tanks last about 10 years, so if your prospective home is nearing this age, be aware you may need to replace the tank. Your home inspector will be able to spot an aging plumbing system, and give you an idea of when it might need to be repaired. 

Moisture in the walls can be a big indicator of a plumbing issue, so if a home inspector spots this, they consider it a red flag almost immediately. Moisture could also mean the presence of mould, which is another big issue. 

Checking water pressure is also important. Too much or not enough pressure can damage the fixtures and pipes. Although it’s best to get a professional’s opinion, if you want to test this on your own there are “easy devices available on sites like Amazon that attach to the end of a faucet to shower neck,” says Anderson.  

4. HVAC systems

Home inspectors also spend time examining the heating, ventilation, and air conditioning (HVAC) of a home. An inspector will check to see if there are any immediate issues with the thermostat and controls, wiring system, as well as the fan, gas lines, and electrical current.

Open windows (at a time of year when it seems a bit odd to do so) could be an indicator of an ill-working HVAC system, as homeowners may be trying distract from the system’s inability to regulate temperature. Dents in the metal, peeling duct tape, loose seams, and torn or collapsed sections of flex ducts could also be indicators the system hasn’t been properly maintained during the current homeowners’ tenure. 

Many home inspectors can perform HVAC checks, and in some instances, it may be a good idea to bring in a professional who specializes in this space.

 Inspecting HVAC systems

5. Roof issues

The roof is one of the first things you see when walking up to a house, and arguably one of the most important to make sure is in good shape. A home inspector will likely climb on top of the roof to get a closer look. They’ll look for things like missing or warped shingles, too much caulk or sealant, and make sure the flashing is in good shape. Flashing is a thin piece of metal installed to keep water away from the walls and chimney. 

Two other roof issues that can occur are moss and a saggy roof. Which one is worse you ask? Anderson says that although moss can cause premature deterioration, it can be cleaned, but a sagging roof is much more serious and requires investigation to determine its cause.

Roofing inspections

6. DIY home repairs

Any time you do a home repair by yourself, you’re risking major red flags come home inspection time. While doing the repairs yourself, or through an unlicensed professional, might save you costs upfront, they can seriously impact the result of a home inspection and end up being the reason a sale falls through. 

The red flags here depend on the project, but typically things like disorganized electrical wires, outlets installed too close to water sources, cracked or jagged tiles around corners, furniture placed in odd spots to hide damage to walls or unsightly warped floors, can all indicate a DIY project which could lead to larger issues and discoveries.  

This isn’t to say you can’t do any types of repairs yourself, but when it comes to things that affect the functionality—especially electrical, plumbing or structural projects—it’s best to leave it to the pros.

Before buying a home, getting a home inspection by a licensed CanNACHI® professional is essential. Not only does it help identify major red flags that could end a deal, but it also gives you insight to potential issues that may come down the line if you chose to go through with the purchase. Moreover, you can have time to budget and prepare for maintenance and potential future upgrades. Finally, a home inspection can also give you leverage during the negotiating process to get you that perfect price. 

Read

Sales and Listing Report June 2023

Highlights of the Dexter Mid-Year 2023 Report

  • Overall housing sales were 194% higher in June compared to January

  • Composite home benchmark price is up 8% from the start of the year

  • Record high prices are being seen in suburban markets

  • Investors pile in as condo prices are nearing record highs

  • Vancouver’s benchmark home price is now higher than New York City

  • Fraser Valley housing sales are up 51.1% from June 2022

The first six months of 2023 proved a thrill ride for Metro Vancouver home buyers and sellers, who switched reins at least three times and still managed to post a surprising pace of real estate transactions, with June sales up 194% from January 2023.

As sales and prices increased, 5,466 new listings joined the action. There were 9,990 properties for sale as June ended, the highest increase month-over-month since earlier in 2022. It was still not enough to satisfy June demand as nearly 3,000 homes were sold. We are still seeing multiple offers at a pace indicative of a true seller’s market. Despite back-to-back months of higher listings, the low inventory keeps buyers competing in most markets, even detached houses in some areas.

In June, the Bank of Canada threw up another interest rate hike to slow the market, but buyers rode right over it. June’s 2,988 total home sales surpassed June 2022 and both sales and prices blew past projections.

“The market continues to outperform expectations across all segments,” said Andrew Lis, REBGV’s director of economics and data analytics. 

As they say, what a ride.

for the full report go to:

https://dexterrealty.com/blog.html/sales-and-listing-report-for-june-2023-7942889

Read

Look Beyond Staging

Professionally staged homes are designed to impact your emotions and your senses. If done well, they tell a story of how you will work, play and entertain in this home - You'll begin to imagine how well you could live if you owned this home. Staging can seduce you and make you want to put your money down and sign on the dotted line.

Fresh-baked cookies or freshly-brewed coffee are inviting aromas that make you want to linger.

The just-delivered look of spotless new furnishings and accessories can show you how to accent this home to perfection. Soft music invites you to relax, take your time, and make yourself at home. Clean uncluttered countertops, beds made with fluffy pillows, and dining rooms replete with elegant place settings show you life at its best - serene and organized. Of course you want to live this way. But before you fall in love, remind yourself that most of the things you're responding to are not included in the purchase price of the home. You're buying the structure, not the décor.

Staging presents the interior and exterior of a home in a way that depersonalizes it from the seller. It doesn't mean the seller lived with the dining table set for a party every day. The idea is to say, "Welcome to your new home", not "Buy my home". That can include rearranging furniture, moving accessories to a new location or starting over with a whole new look - fresh paint and updated "borrowed" furnishings.

Your goal is to buy the best home you can possibly afford that meets your needs. Look carefully at things that are fixed - systems, fixtures, and floorplans. Think about how you want to live. No home is perfect but does this home answer most of your needs? Ask yourself the following:

• Does it flow well and could you get groceries to the kitchen quickly and easily?

• Can more than one person cook or assist with meal preparation?

• Do household members have a nice balance of privacy and places to gather?

• Do you have enough storage and are the rooms large enough for their purpose?

• Is there a place for your home office, art studio, or woodshop? • Does the house need updating to better meet your needs?

• Which systems need replacing or will need replacing soon, such as the roof, AC or a large appliance? Would they be reasonable or affordable, given the purchase price?

It's nice to see any home finished to look its best. You can get great ideas as you walk through a staged home. Just remember to give the systems, appliances, floorplan and condition the attention they deserve.

Read

Strata Tips

When looking to purchase a strata lot, it is important to review the alterations made in the unit, and make sure the proper processes have been followed and approvals received.


There are a few questions you should be asking when considering the alterations that have been made within a strata lot:

  • Have previous owners asked for and received approval for the alterations?

  • Are there any agreements (aka. alteration agreements or indemnity agreements) that make the owners responsible for future repairs or replacement of the alterations, as well as insuring these?

  • Has the work been done according to the terms set in the agreements?

The first sign that the alterations may have been made without the strata corporation’s approval is if the strata lot appears to have had upgrades, such as new kitchen cabinets or flooring, yet the Form B notes that “no agreements exist under which the owner of the strata lot takes responsibility for expenses relating to alterations”.

When an owner decides to upgrade an original fixture, strata corporations typically require the owner to sign an agreement making them responsible for insuring the fixture, as well as all future repairs and/or replacements.

If no agreements exist, yet the unit appears to have had upgrades, there’s a risk that the alterations were made without the strata corporation’s approval. In this case, the strata council may require that the strata lot be returned to its original condition at the owner’s cost, and the owner could also be liable for fines.

In order to avoid issues when purchasing a strata lot which has unapproved alterations, it may be prudent to require that the current owner obtain retroactive approval of the alterations, prior to the subject removal date. This will ensure you do not run into issues after purchasing the strata lot.

Read

How a REALTOR® Prices your Home

How a REALTOR® Prices Your Home

You’ve loved your home but are ready to move on. How much should you list it for? Although a casual observer might believe a listing price is an arbitrary number, many factors are taken into consideration when pricing, including market conditions, historical data, location and amenities. Overprice a property and it could linger, unsold, for months. Undervalue it, and you’re leaving money on the table. While getting a home appraisal can give you an idea of your property’s worth, pricing a home is part science and part art, so we asked a REALTOR® to break down that process.

“When I’m asked to price a property, there are many aspects involved and lots of fine-tuning,” says David Stevens, a REALTOR® with Royal LePage Coast Capital Realty in Victoria, British Columbia. Some considerations include:

Current local market conditions 

Pricing a home should include looking at the current market conditions and trends in your area. Knowing how many properties with similar features are up for sale and how fast they’re being snapped up can help determine how a property should be priced. 

“This takes into account the ability of active buyers and their buying power or capability,” adds Stevens. “Comparable current and sold listings are an invaluable source of information to look at when pricing, because sold property prices can always be relayed to any buyer or seller by their REALTOR®.”

When there’s low inventory in a neighbourhood, this can create a seller’s market with more competitive listing prices, while a bunch of homes for sale may require lower asking prices and indicate it’s more of a buyer’s market.

Location 

Sought after neighbourhoods near well-respected schools will typically demand a higher price tag,” explains Stevens. 

Remember: even homes on the same street can differ in price—if one side of the street backs onto a body of water, for example, those homes could be priced higher.

Size and layout

 A home’s layout can also factor into its pricing; most families in his market look for three or more bedrooms on one level, notes Stevens. 

“The square footage of a home and land size also influences the value of a property,” he says. “Depending on the area and the buyer trend in an area, aspects like privacy or usable land play a role.”

Age and condition of the house

How old a property is, and whether it has or needs major updates, including windows, roof, kitchen, bathrooms, and mechanical systems all factor into pricing. 

“When the major components of a home have been updated or replaced, many buyers see that as a long-term investment they will not need to spend money on,” explains Stevens.

DIY projects gone wrong can be detrimental in obtaining top dollar because substandard work will decrease your home’s appeal and, therefore, the price, he adds. 

Bonus spaces

A home with an in-law suite or additional income potential can be important as it gives the buyer flexibility with their financing and buying capability, he adds. 

“Within urban communities, it may be hard for a buyer who wants a detached workshop or a studio. This is considered special and not easy to find, so it must be taken into consideration when pricing.”

Seller’s motivation

REALTORS® also take a seller’s motivation into account when pricing a property. For example, if a seller has an accepted offer on another property, or they’re being transferred out of town, they may ask for a compelling listing price to attract more buyers, says Stevens.

What is the MLS® Home Price Index and how does it work? 

REALTORS® have a powerful tool at their disposal—the MLS® Home Price Index (MLS® HPI). It provides a more precise picture of home price trends by gauging prices for the market as a whole, and prices for specific housing categories. This information allows them to do a comparable market analysis, where they learn what other similar homes have recently sold for, which gives them solid indicators on how to price your property.

Because this data can change from month to month, it’s important to use an accurate tool that tracks prices to get the latest information. 

“Ultimately, the pricing of a home is the seller’s decision with the help of their REALTOR®,” says Stevens. “The goal is to price the property to attract serious buyers and to prevent an extended period of time on the market that may ultimately come at a cost.”

Working with a REALTOR® to price your home gives you peace of mind that you’re setting yourself up for success with the advice and expertise of a professional. 

You may also be interested in reading…

Wendy Helfenbaum

Wendy Helfenbaum is a Montreal-based journalist, content strategist and TV producer who covers real estate, architecture, design, DIY, travel and gardening. 

Read

The Multigenerational Home Renovation Tax Credit: What You Need to Know

Written Curtesy REALTOR.CA TEAM

An increasing number of Canadians are turning to multi-generational living to help save money and cut down on their cost of living.

In fact, the number of homes shared by multiple generations of a family, two or more families, or one family living with non-related persons has risen by 45% in 20 years, according to the latest census data from Statistics Canada. By 2021, there were close to one million of these types of households, making up 7% of all homes in Canada. 

In recognition of this growing trend, the federal government proposed the multi-generational home renovation tax credit in its 2022 budget. As of January 1, 2023, the tax credit is officially in effect. The goal, as promised by the Liberal government during the 2021 election campaign, is to “help make communities more livable while bringing families closer together and better able to care for one another.”

What is the multi-generational home renovation tax credit?

The multi-generational home renovation tax credit is available to families interested in constructing a secondary unit on their property. Eligible families can claim 15% on expenses up to $50,000, so long as the expenses are related to the renovation and incurred after January 1, 2023. The maximum claim is $7,500, and only one qualifying renovation can be claimed per eligible person in their lifetime.

The multi-generational home renovation tax credit helps answer the wide-spread need for more affordable housing. In addition, the credit encourages homeowners to better utilize single-family homes, while reaping the financial and emotional benefits of living with family.

Secondary suites are also a form of middle housing, which is a concept that has gained momentum in many Canadian markets. Middle housing is touted as a way to reshape existing neighbourhoods so they can serve the housing needs of more Canadians, while helping to mitigate urban sprawl. 

What are the qualifications for the multigenerational home renovation tax credit?

In order to qualify for the multigenerational home renovation tax credit, the secondary unit and its residents must meet a few eligibility requirements.

  • The residence must be for seniors over the age of 65, or adults over the age of 18 who are eligible for the disability tax credit within the taxation year that includes the end of the renovation period.
  • The primary property must be owned by the eligible person, the spouse or common-law partner of the eligible person, or a qualifying relation of the eligible person, which could be a parent, grandparent, child, grandchild, brother, sister, aunt, uncle, niece, or nephew.
  • The secondary unit itself must be a self-contained dwelling unit with a private entrance, kitchen, bathroom facilities, and sleeping area. This could be a brand new unit, or an existing unit that requires renovations to meet the requirements of a secondary unit.
  • In most cases, the unit must be inhabited within 12 months after the renovation is completed.

What expenses are—and aren’t—covered under the credit?

As with every tax credit, it’s important to know what you can and can’t claim. 

Eligible expenses include: 

  • a newly constructed unit or an existing unit that has been renovated and meets the government’s requirements; and
  • the cost of labour accrued by yourself or professional services, building materials, fixtures, equipment rentals, and permits. All costs must be supported by receipts.

Certain things cannot be claimed, such as:

  • furniture;
  • household appliances and devices;
  • costs associated with landscaping, housekeeping, or security—in other words, anything not integral to the unit itself;
  • costs of financing a renovation, such as mortgage interest costs; and
  • construction equipment, tools, mortgage interest costs, and any costs associated with routine repair or maintenance.

In addition, claims are subject to reduction pending other forms of government assistance. 

By supporting families in their efforts to create private-yet-together living spaces, this tax credit can help ease some of the stress and provide a viable living option for many Canadians. 

If you’re interested in applying, be sure to read up on the full eligibility and requirements to ensure you qualify for the tax credit, and keep receipts of all your associated costs. You can apply for the tax credit on your 2023 income tax return in 2024.

The information above is for informational purposes only and should not be used as investment or financial advice.

Read

Summary of Government Real Estate Regulations & Dates

City of Vancouver Empty Homes Tax

  • Starting in 2023, the City of Vancouver Empty Homes Tax will be 5% for any homes deemed empty in 2023 (up from 3% in 2022)
  • Declaration Due Date is February 2
  • All homeowners must complete a declaration and confirm exemptions, if applicable
  • Clauses required in CPS to protect buyer
  • https://vancouver.ca/home-property-development/empty-homes-tax.aspx 

 B.C. Speculation and Vacancy Tax

  • The BC Speculation and Vacancy Tax is 0.5% for Canadian Citizens or Permanent Residents and 2% for foreign owners and satellite families
  • Declaration Due Date is March 31
  • All owners on title must complete a declaration, even if they are spouses
  • Areas covered – Capital Regional District (Victoria and surrounding areas), Metro Vancouver Regional District including Lions Bay and Squamish and out to Langley, Abbotsford, Mission, Chilliwack, Kelowna, West Kelowna, Nanaimo, Lantzville (use link to confirm areas)
  • No clauses needed in CPS to protect buyer
  • https://www2.gov.bc.ca/gov/content/taxes/speculation-vacancy-tax 

 Canadian Underused Housing Tax

  • Starting in 2023 for the 2022 tax year, an annual 1% tax on the taxable value of a vacant or underused residential property that is directly or indirectly owned by a non-resident non-Canadian
  • CRA filing by April 30th
  • Excluded Owner does not have to file – Canadian Citizens and permanent residents of Canada are Excluded Owners, some exceptions may trigger a requirement to file though
  • All of Canada is covered by this tax
  • No clauses needed in CPS to protect buyer
  • https://www.canada.ca/en/services/taxes/excise-taxes-duties-and-levies/underused-housing-tax.html 

 B.C. 3-Day Home Buyer Rescission Period

  • Effective January 3, 2023
  • Affects residential properties other than leasehold, auction, court order, presale
  • Provides a buyer with a 3-day rescission period starting the day after acceptance and doesn’t include Saturday, Sunday or holidays as determined by the Interpretations Act
  • If a buyer rescinds, they are required to pay the seller a 0.25% penalty, which can be paid from any deposits held in the brokerage trust account or if no deposits were given, the seller would to pursue the buyer for the penalty
  • Cannot waive the rescission period.
  • Contract of Purchase and Sale must contain the exact rescission amount based on purchase price, the contact for sending rescission notice to, the final acceptance date and the last date rescission can happen.
  • Rescission can be done on the required form by way of registered mail, fax or email with a read receipt.
  • https://www.bcfsa.ca/industry-resources/real-estate-professional-resources/knowledge-base/guidelines/home-buyer-rescission-period-guideline

 B.C. Foreign Buyer Tax

 Canada 2-Year Foreign Buyer Ban

  • Starting January 1, 2023, non-Canadian citizens and non-permanent residents will be prohibited from purchasing residential property in Canada for two years, purchasing either directly or indirectly (meaning buyers not on the contract but a beneficial owner is prohibited)
  • Agreements signed before January 1, 2023 will not be subject to the prohibition.
  • Prohibition covers properties in either a “census agglomeration” or a “census metropolitan area” – for example Whistler is exempt. https://www12.statcan.gc.ca/census-recensement/2021/geo/maps-cartes/referencemaps-cartesdereference/sgc-cgt/map-eng.cfm?SGC=01_C
  • Affects residential properties and buildings of up to 3 dwelling units (multifamily rental buildings)
  • Includes vacant residential land
  • Applies to individuals and corporations with a non-Canadian with 3% interest or more
  • Some exemptions may apply, see legislation and legal advice required to determine if applicable
  • Contravention of the Act can result in $10,000 for all parties involved (buyer, seller, lawyer/notary, real estate agent and brokerages, lenders, etc) and could result in an order to sell the property and any profit would go to the government.
  • A property may be exempt from the Foreign Buyer Ban but still attract the Foreign Buyer Tax.
  • Have the buyer sign the Certificate and Consent of Purchaser form to confirm they are able to purchase
  • https://canadagazette.gc.ca/rp-pr/p2/2022/2022-12-21/html/sor-dors250-eng.html

Anti-Flipping Rule

Read

Mid Jan 2023 Market Report - It's not how it looks.

As the calendar turned to 2023, transacting real estate in British Columbia became a lot more complicated. Having dealt with a City of Vancouver Empty Homes Tax, the provincial Speculation and Vacancy Tax and a provincial foreign buyer’s tax, we now have a provincial 3 Day Home Buyer Rescission Period, a two-year ban on foreign buyers across Canada, a national Underused Homes Tax – essentially a Canada wide empty homes tax for foreign owned properties and a national anti-flipping tax which would see any profits for sales within a year of purchase taxed as business income.


If your new years resolution was more government regulation, you got it! All these policies focus on the demand side of the transaction and guess what – they don’t and wont work! We started the year yet again with an extremely low level of active listings, and so far, that’s not changing. While sales are slow to start the year, we are only two weeks in and rescission or not, buyers are out shopping. Will they find more homes stocked on the shelves as we move through the first part of 2023, that remains an important question.

At the mid-point of January, there have been 334 sales in Greater Vancouver. This is well below the 795 at the mid-point in December and of course below the 788 at the mid-point of January last year, which was a completely different market. If we compare to January 2019, which was coming out of one of the slowest years on record, it was more closely matched with there being 396 sales in January 2019. It’s still early, and the number of sales in January in the second half tend to be more than 3 times what they are in the first two weeks. And if there is a more significant increase in the number of new listings, the number of sales will be that much higher. January 2019 finished with 1,120 sales after a similar start to this month, so it is quite likely we’ll see similar numbers if not more depending on whether sellers come to the market this month. And judging by the comments of REALTORS® over the last two weeks, open houses have been much busier than the fall, listings that were quiet are getting attention and there have been multiple offers occurring on what limited number of homes there are on the market. After sitting through the last few months of the year, some listings are seeing offers come in. Perhaps a sign that buyers are adjusting to the new levels of interest rates and that the pent-up demand is starting to get more active. And most certainly a sign that sellers may want to jump on an early spring market.

At mid-month in Greater Vancouver there have been only 1,379 new listings, which is above the 984 new listings at the mid-point of December but significantly below the 1,639 new listings at the midpoint of January 2022 and much more below the number of new listings of 1,940 at the mid-point of January 2019 – you know, that other slow market period. After seeing active listings drop below 7,000 in Greater Vancouver, there are now 7,294 listings, up, but ever so slightly. A 24% sales-to-listings ratio has helped, but with the few numbers of new listings, it’s not adding much to the well of active listings so far.  

While it is too early to recognize trends in any market, North Vancouver, West Vancouver, and Port Moody appear to be the slowest out of the gate for sales. As of the middle of the month, Port Moody only had two sales – and they were condos and North Vancouver had only seen one townhouse sale. Certainly, in the case of Port Moody, the available number of new listings is a contributing factor in the low number of sales. New Westminster is following along the same path for new listings as December, very few and as a result that’s holding back sales. Coquitlam is bucking the trend with a higher pace of new listings so far in January, with the condo segment being the larger supplier of new listings. And with Coquitlam City Council starting its first meeting of 2023 by sending the Polygon proposal for a massive development out for comment that would see 2,835 units built at the Port Moody border, just north of Lougheed Highway, more supply could be on the way This would be like what Marcon Quadreal is planning to build at the corner of Lougheed and Barnet Highway. All while Port Moody is seeing a bid from Wesgroup to rezone 59 single-family homes for a high-density development. There is a focus on development in these two cites – perhaps something others should take note of. And given the lack of listings buyers have to shop from, they can’t come soon enough.


Here’s a summary of the numbers:


Greater Vancouver 

334 units sold so far in January 2023 compared to 
793 units sold at mid-month in December 2022 
788 units sold at mid-month in January 2022
977 units sold at mid-month in January 2021
538 units sold at mid-month in January 2020
396 units sold at mid-month in January 2019

1,379 new listings so far in January compared to
984 new listings at mid-month in December 2022 
1,639 new listings at mid-month in January 2022
2,185 new listings at mid-month in January 2021
1,924 new listings at mid-month in January 2020
1,940 new listings at mid-month in January 2019

Total active listings are at 7,294 compared to 5,427 at mid-month in January 2022, and 8,787 at mid-month in December 2022.

Sales to listings ratio is at 24% compared to 48% at mid-month in January 2022 and 81% at mid-month in December 2022.

Vancouver West 

62 units sold so far in January 2023 compared to 
157 units sold at mid-month in December 2022 
152 units sold at mid-month in January 2022
154 units sold at mid-month in January 2021
89 units sold at mid-month in January 2020
57 units sold at mid-month in January 2019

303 new listings so far in January compared to
194 new listings at mid-month in December 2022 
395 new listings at mid-month in January 2022
426 new listings at mid-month in January 2021
178 new listings at mid-month in January 2020
193 new listings at mid-month in January 2019

Total active listings are at 1,723 compared to 1,637 at mid-month in January 2022, and 2,085 at mid-month in December 2022.

Sales to listings ratio is at 20% compared to 48% at mid-month in January 2022 and 81% at mid-month in December 2022.

Vancouver East

41 units sold so far in January 2023 compared to 
75 units sold at mid-month in December 2022 
88 units sold at mid-month in January 2022
97 units sold at mid-month in January 2021
48 units sold at mid-month in January 2020
41 units sold at mid-month in January 2019

144 new listings so far in January compared to
109 new listings at mid-month in December 2022 
153 new listings at mid-month in January 2022
236 new listings at mid-month in January 2021
178 new listings at mid-month in January 2020
193 new listings at mid-month in January 2019

Total active listings are at 793 compared to 652 at mid-month in January 2022, and 979 at mid-month in December 2022.

Sales to listings ratio is at 28% compared to 58% at mid-month in January 2022 and 69% at mid-month in December 2022.

North Vancouver

20 units sold so far in January 2023 compared to 
69 units sold at mid-month in December 2022 
49 units sold at mid-month in January 2022
55 units sold at mid-month in January 2021
30 units sold at mid-month in January 2020
31 units sold at mid-month in January 2019

93 new listings so far in January compared to
62 new listings at mid-month in December 2022 
82 new listings at mid-month in January 2022
155 new listings at mid-month in January 2021
163 new listings at mid-month in January 2020
151 new listings at mid-month in January 2019

Total active listings are at 377 compared to 233 at mid-month in January 2022, and 442 at mid-month in December 2022.

Sales to listings ratio is at 22% compared to 60% at mid-month in January 2022 and 111% at mid-month in December 2022.

West Vancouver 

8 units sold so far in January 2023 compared to 
28 units sold at mid-month in December 2022 
11 units sold at mid-month in January 2022
20 units sold at mid-month in January 2021
10 units sold at mid-month in January 2020
7 units sold at mid-month in January 2019

46 new listings so far in January compared to
145 new listings at mid-month in December 2022 
52 new listings at mid-month in January 2022
96 new listings at mid-month in January 2021
91 new listings at mid-month in January 2020
59 new listings at mid-month in January 2019

Total active listings are at 395 compared to 337 at mid-month in January 2022, and 496 at mid-month in December 2022.

Sales to listings ratio is at 17% compared to 21% at mid-month in January 2022 and 76% at mid-month in December 2022.

Richmond

47 units sold so far in January 2023 compared to 
104 units sold at mid-month in December 2022 
130 units sold at mid-month in January 2022
127 units sold at mid-month in January 2021
92 units sold at mid-month in January 2020
49 units sold at mid-month in January 2019

196 new listings so far in January compared to
145 new listings at mid-month in December 2022 
266 new listings at mid-month in January 2022
277 new listings at mid-month in January 2021
264 new listings at mid-month in January 2020
293 new listings at mid-month in January 2019

Total active listings are at 879 compared to 722 at mid-month in January 2022, and 1,048 at mid-month in December 2022.

Sales to listings ratio is at 24% compared to 49% at mid-month in January 2022 and 72% at mid-month in December 2022.

Burnaby East 

3 units sold so far in January 2023 compared to 
7 units sold at mid-month in December 2022 
6 units sold at mid-month in January 2022
5 units sold at mid-month in January 2021
8 units sold at mid-month in January 2020
3 units sold at mid-month in January 2019

11 new listings so far in January compared to
13 new listings at mid-month in December 2022 
11 new listings at mid-month in January 2022
19 new listings at mid-month in January 2021
21 new listings at mid-month in January 2020
22 new listings at mid-month in January 2019

Total active listings are at 69 compared to 29 at mid-month in January 2022, and 91 at mid-month in December 2022.
Sales to listings ratio is at 27% compared to 55% at mid-month in January 2022 and 54% at mid-month in December 2022.

Burnaby North 

21 units sold so far in January 2023 compared to 
46 units sold at mid-month in December 2022 
36 units sold at mid-month in January 2022
61 units sold at mid-month in January 2021
38 units sold at mid-month in January 2020
22 units sold at mid-month in January 2019

70 new listings so far in January compared to
58 new listings at mid-month in December 2022 
83 new listings at mid-month in January 2022
130 new listings at mid-month in January 2021
99 new listings at mid-month in January 2020
91 new listings at mid-month in January 2019

Total active listings are at 343 compared to 236 at mid-month in January 2022, and 391 at mid-month in December 2022.

Sales to listings ratio is at 30% compared to 43% at mid-month in January 2022 and 79% at mid-month in December 2022.

Burnaby South 

15 units sold so far in January 2023 compared to 
57 units sold at mid-month in December 2022 
54 units sold at mid-month in January 2022
72 units sold at mid-month in January 2021
41 units sold at mid-month in January 2020
23 units sold at mid-month in January 2019

66 new listings so far in January compared to
45 new listings at mid-month in December 2022 
116 new listings at mid-month in January 2022
136 new listings at mid-month in January 2021
106 new listings at mid-month in January 2020
105 new listings at mid-month in January 2019

Total active listings are at 324 compared to 264 at mid-month in January 2022, and 835 at mid-month in December 2022.

Sales to listings ratio is at 23% compared to 47% at mid-month in January 2022 and 127% at mid-month in December 2022.

New Westminster 

15 units sold so far in January 2023 compared to 
31 units sold at mid-month in December 2022 
38 units sold at mid-month in January 2022
36 units sold at mid-month in January 2021
18 units sold at mid-month in January 2020
27 units sold at mid-month in January 2019

37 new listings so far in January compared to
22 new listings at mid-month in December 2022 
62 new listings at mid-month in January 2022
100 new listings at mid-month in January 2021
18 new listings at mid-month in January 2020
27 new listings at mid-month in January 2019

Total active listings are at 203 compared to 145 at mid-month in January 2022, and 264 at mid-month in December 2022.

Sales to listings ratio is at 41% compared to 61% at mid-month in January 2022 and 141% at mid-month in December 2022.

Coquitlam 

22 units sold so far in January 2023 compared to 
45 units sold at mid-month in December 2022 
64 units sold at mid-month in January 2022
104 units sold at mid-month in January 2021
57 units sold at mid-month in January 2020
27 units sold at mid-month in January 2019

107 new listings so far in January compared to
64 new listings at mid-month in December 2022 
91 new listings at mid-month in January 2022
161 new listings at mid-month in January 2021
140 new listings at mid-month in January 2020
144 new listings at mid-month in January 2019

Total active listings are at 434 compared to 255 at mid-month in January 2022, and 536 at mid-month in December 2022.

Sales to listings ratio is at 21% compared to 70% at mid-month in January 2022 and 70% at mid-month in December 2022.

Port Moody

2 units sold so far in January 2023 compared to 
28 units sold at mid-month in December 2022 
19 units sold at mid-month in January 2022
17 units sold at mid-month in January 2021
16 units sold at mid-month in January 2020
10 units sold at mid-month in January 2019

43 new listings so far in January compared to
32 new listings at mid-month in December 2022 
25 new listings at mid-month in January 2022
34 new listings at mid-month in January 2021
31 new listings at mid-month in January 2020
25 new listings at mid-month in January 2019

Total active listings are at 165 compared to 81 at mid-month in January 2022, and 167 at mid-month in December 2022.

Sales to listings ratio is at 5% compared to 76% at mid-month in January 2022 and 88% at mid-month in December 2022.

Port Coquitlam 

16 units sold so far in January 2023 compared to 
17 units sold at mid-month in December 2022 
19 units sold at mid-month in January 2022
25 units sold at mid-month in January 2021
21 units sold at mid-month in January 2020
16 units sold at mid-month in January 2019

29 new listings so far in January compared to
34 new listings at mid-month in December 2022 
44 new listings at mid-month in January 2022
80 new listings at mid-month in January 2021
65 new listings at mid-month in January 2020
67 new listings at mid-month in January 2019

Total active listings are at 123 compared to 66 at mid-month in January 2022, and 166 at mid-month in December 2022.

Sales to listings ratio is at 55% compared to 43% at mid-month in January 2022 and 50% at mid-month in December 2022.

Ladner 

5 units sold so far in January 2023 compared to 
5 units sold at mid-month in December 2022 
9 units sold at mid-month in January 2022
7 units sold at mid-month in January 2021
12 units sold at mid-month in January 2020
1 units sold at mid-month in January 2019

18 new listings so far in January compared to
14 new listings at mid-month in December 2022 
16 new listings at mid-month in January 2022
15 new listings at mid-month in January 2021
37 new listings at mid-month in January 2020
24 new listings at mid-month in January 2019

Total active listings are at 72 compared to 34 at mid-month in January 2022, and 86 at mid-month in December 2022.
Sales to listings ratio is at 28% compared to 56% at mid-month in January 2022 and 36% at mid-month in December 2022.

Tsawwassen

7 units sold so far in January 2023 compared to 
19 units sold at mid-month in December 2022 
13 units sold at mid-month in January 2022
16 units sold at mid-month in January 2021
7 units sold at mid-month in January 2020
2 units sold at mid-month in January 2019

21 new listings so far in January compared to
16 new listings at mid-month in December 2022 
33 new listings at mid-month in January 2022
43 new listings at mid-month in January 2021
37 new listings at mid-month in January 2020
37 new listings at mid-month in January 2019

Total active listings are at 120 compared to 74 at mid-month in January 2022, and 135 at mid-month in December 2022.

Sales to listings ratio is at 33% compared to 39% at mid-month in January 2022 and 119% at mid-month in December 2022.


Download January Sales and Listings Statistics Houses Townhouses Condos

Download January Sales and Listings Statistics All Regional


Kevin Skipworth
Partner/Broker and Chief Economist at Dexter Realty

Read
Reciprocity Logo The data relating to real estate on this website comes in part from the MLS® Reciprocity program of either the Greater Vancouver REALTORS® (GVR), the Fraser Valley Real Estate Board (FVREB) or the Chilliwack and District Real Estate Board (CADREB). Real estate listings held by participating real estate firms are marked with the MLS® logo and detailed information about the listing includes the name of the listing agent. This representation is based in whole or part on data generated by either the GVR, the FVREB or the CADREB which assumes no responsibility for its accuracy. The materials contained on this page may not be reproduced without the express written consent of either the GVR, the FVREB or the CADREB.